Reframing people management service
Reframing setup and onboarding user flows in the dashboard
Problem
Yomi helps companies achieve business goals and maintain team engagement through effective skills development and behavior change.
The project team consisted of a product manager, developers, analysts, a leadership coach and a behavior change specialist.
The product had some difficulties with onboarding new users. And also with program management, its customization for specific situations. While the product metrics were good, new client attraction and renewal of the program left much to be desired.
How I found a solution
The product was already launched and had an active user base, so in this project I worked as closely as possible with analyzing metrics, studying conversions and identifying weaknesses and user churn.
Also, due to the specifics of the product, there was a regular opportunity to communicate with users. What I actively used: I conducted surveys, usability testing and organized interviews with different groups of users.
What was done
For most B2B products, calm, austere, "business-like" layouts are used. Most often, this is due to the seriousness of the product and certain functionality.
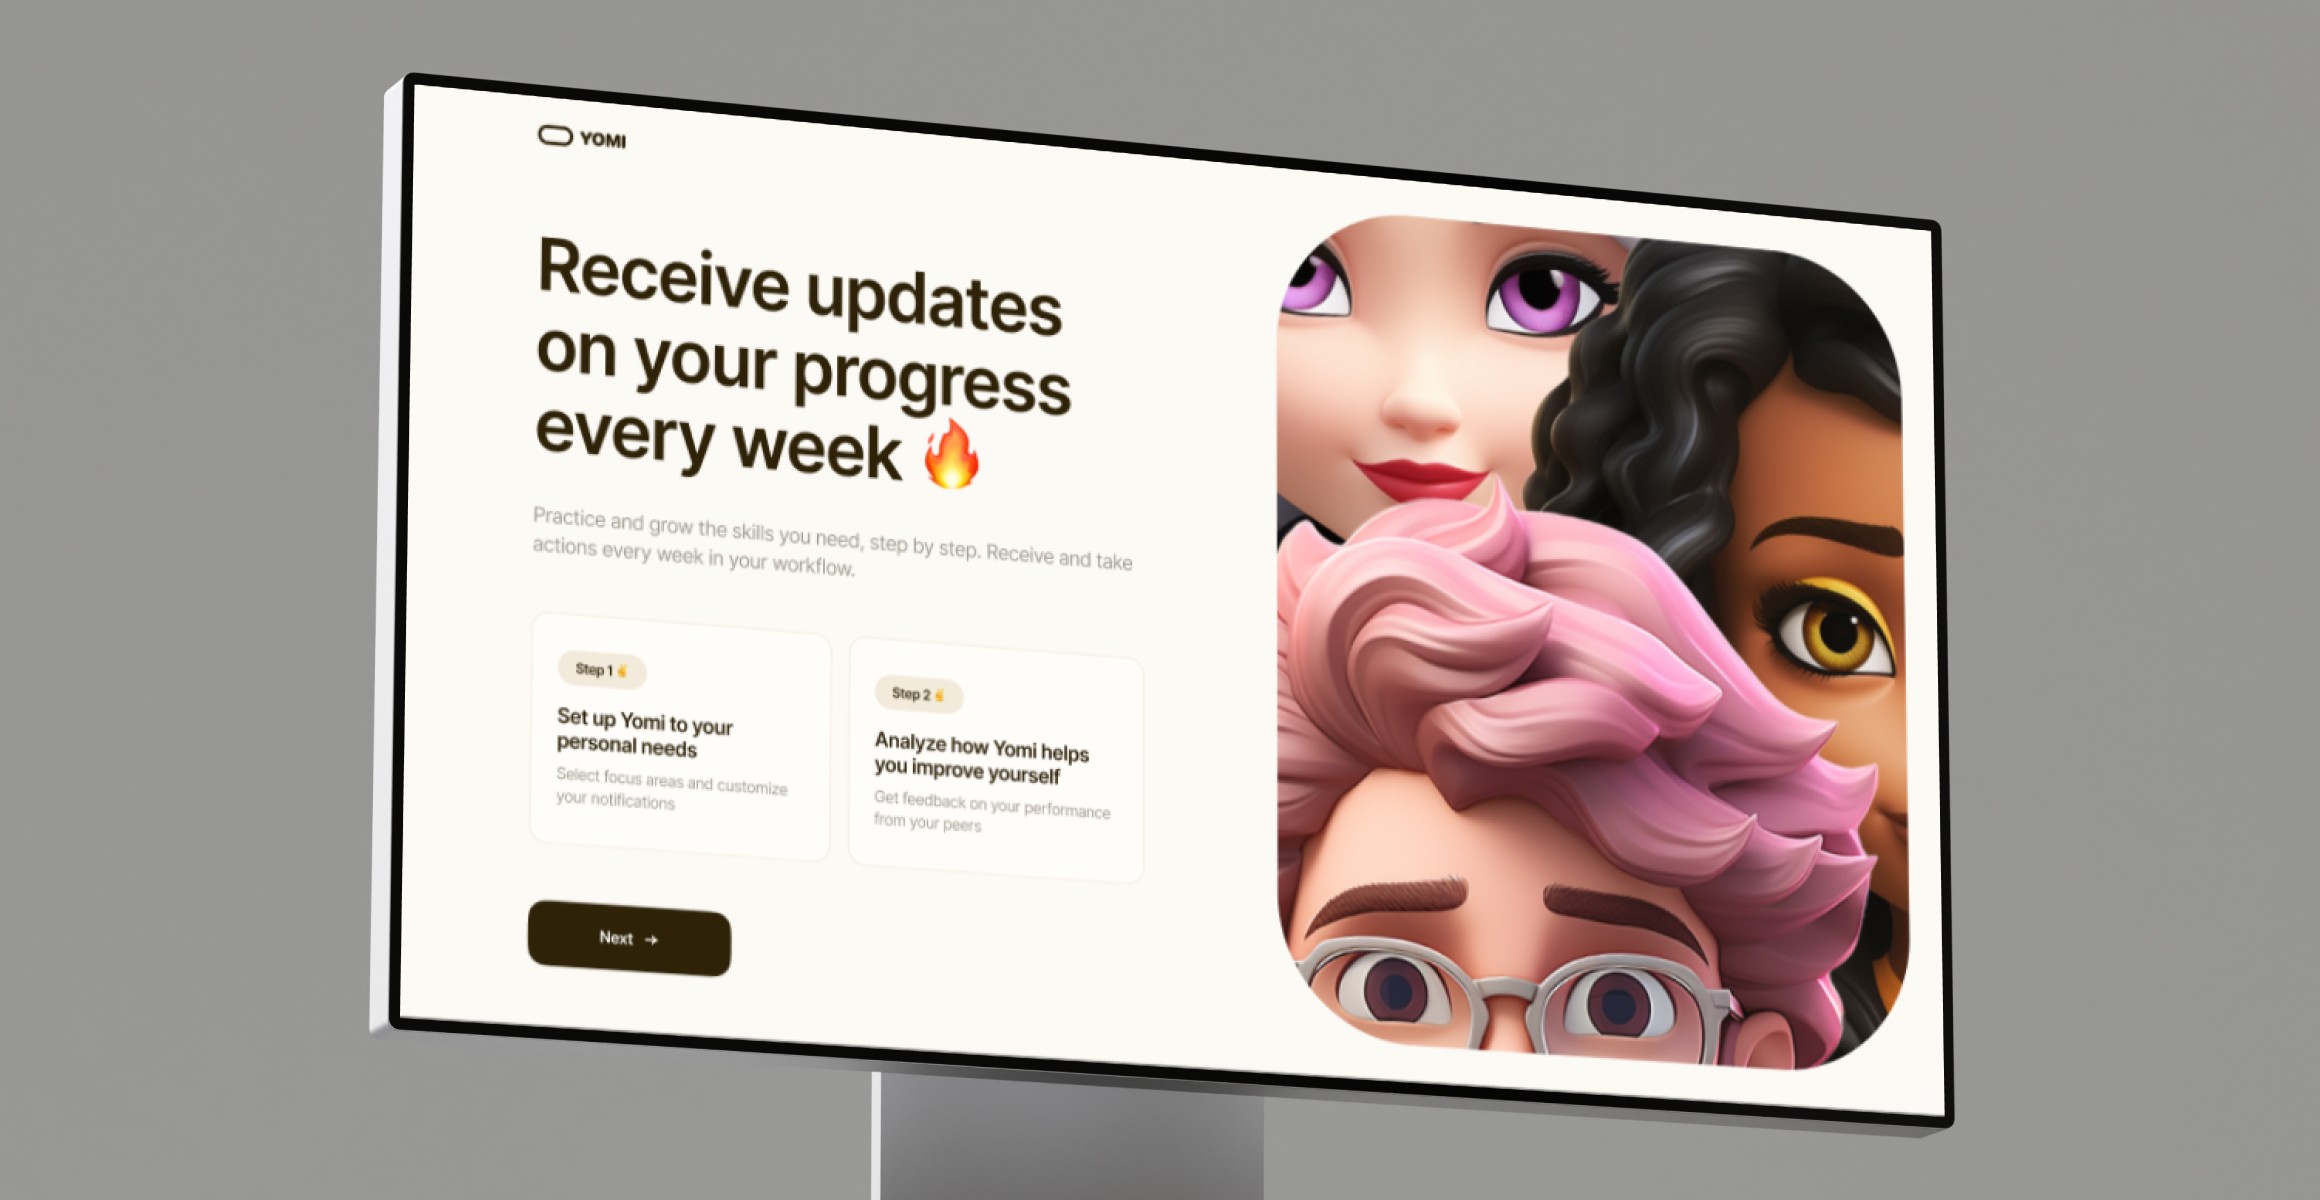
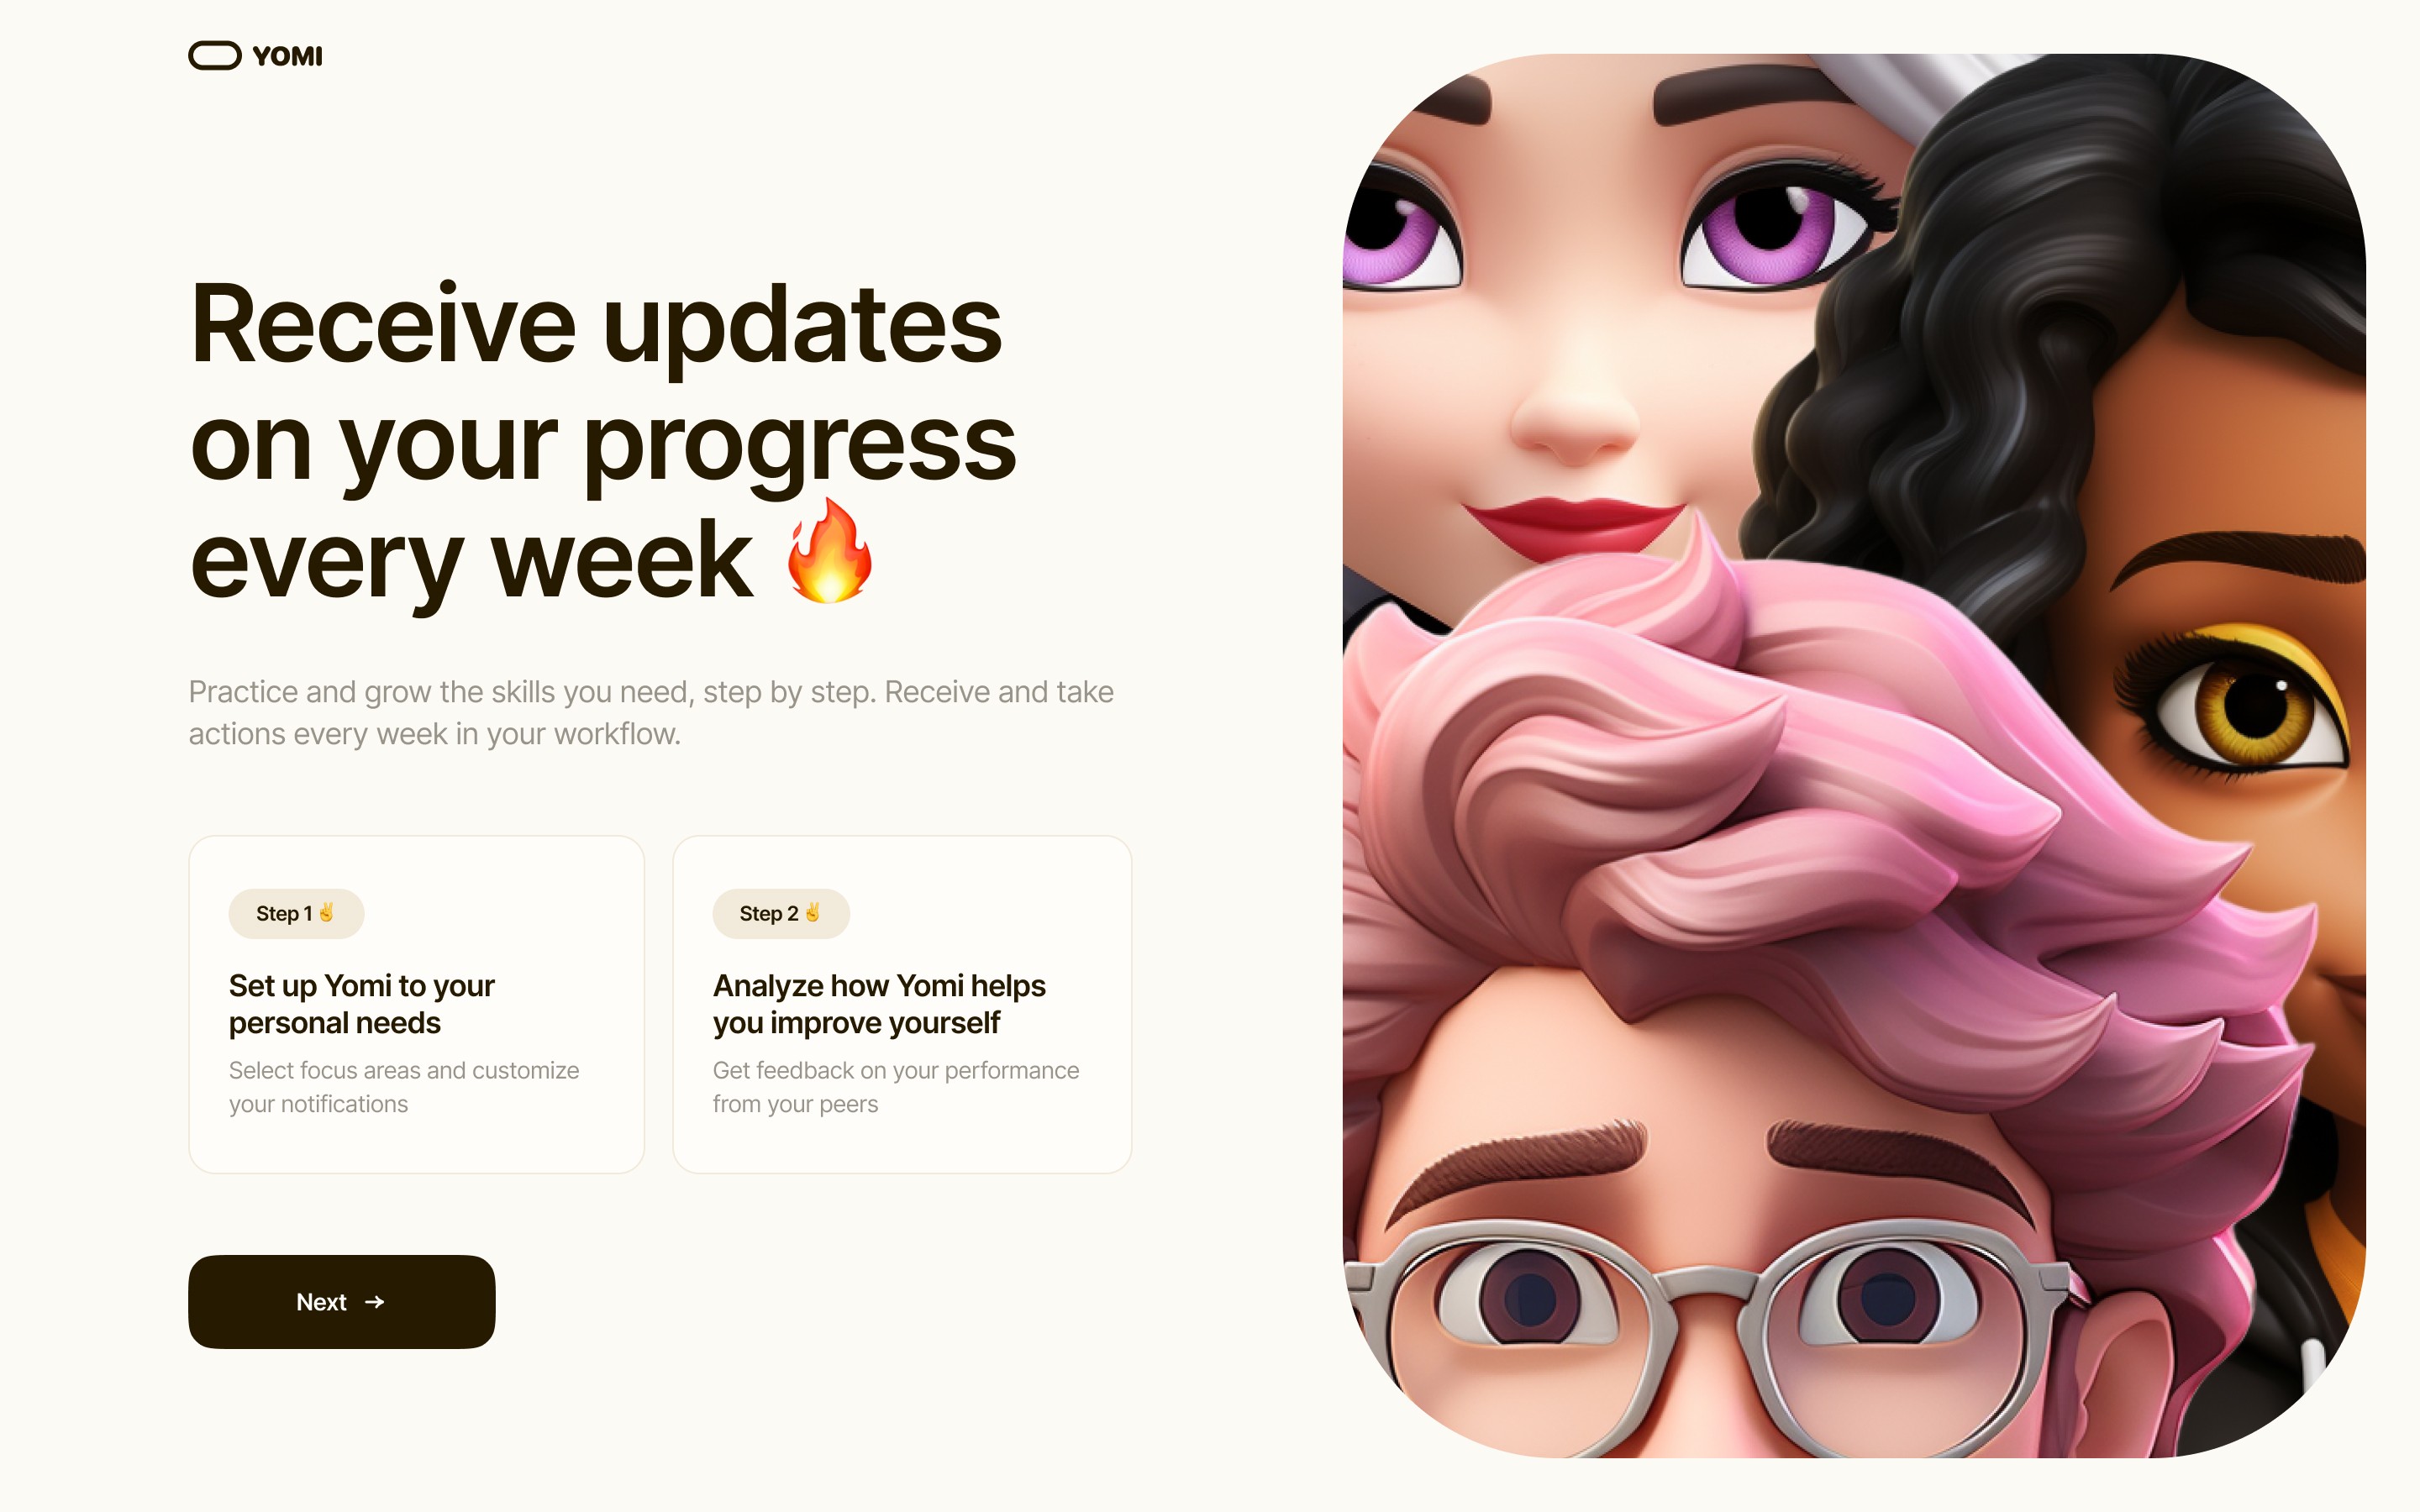
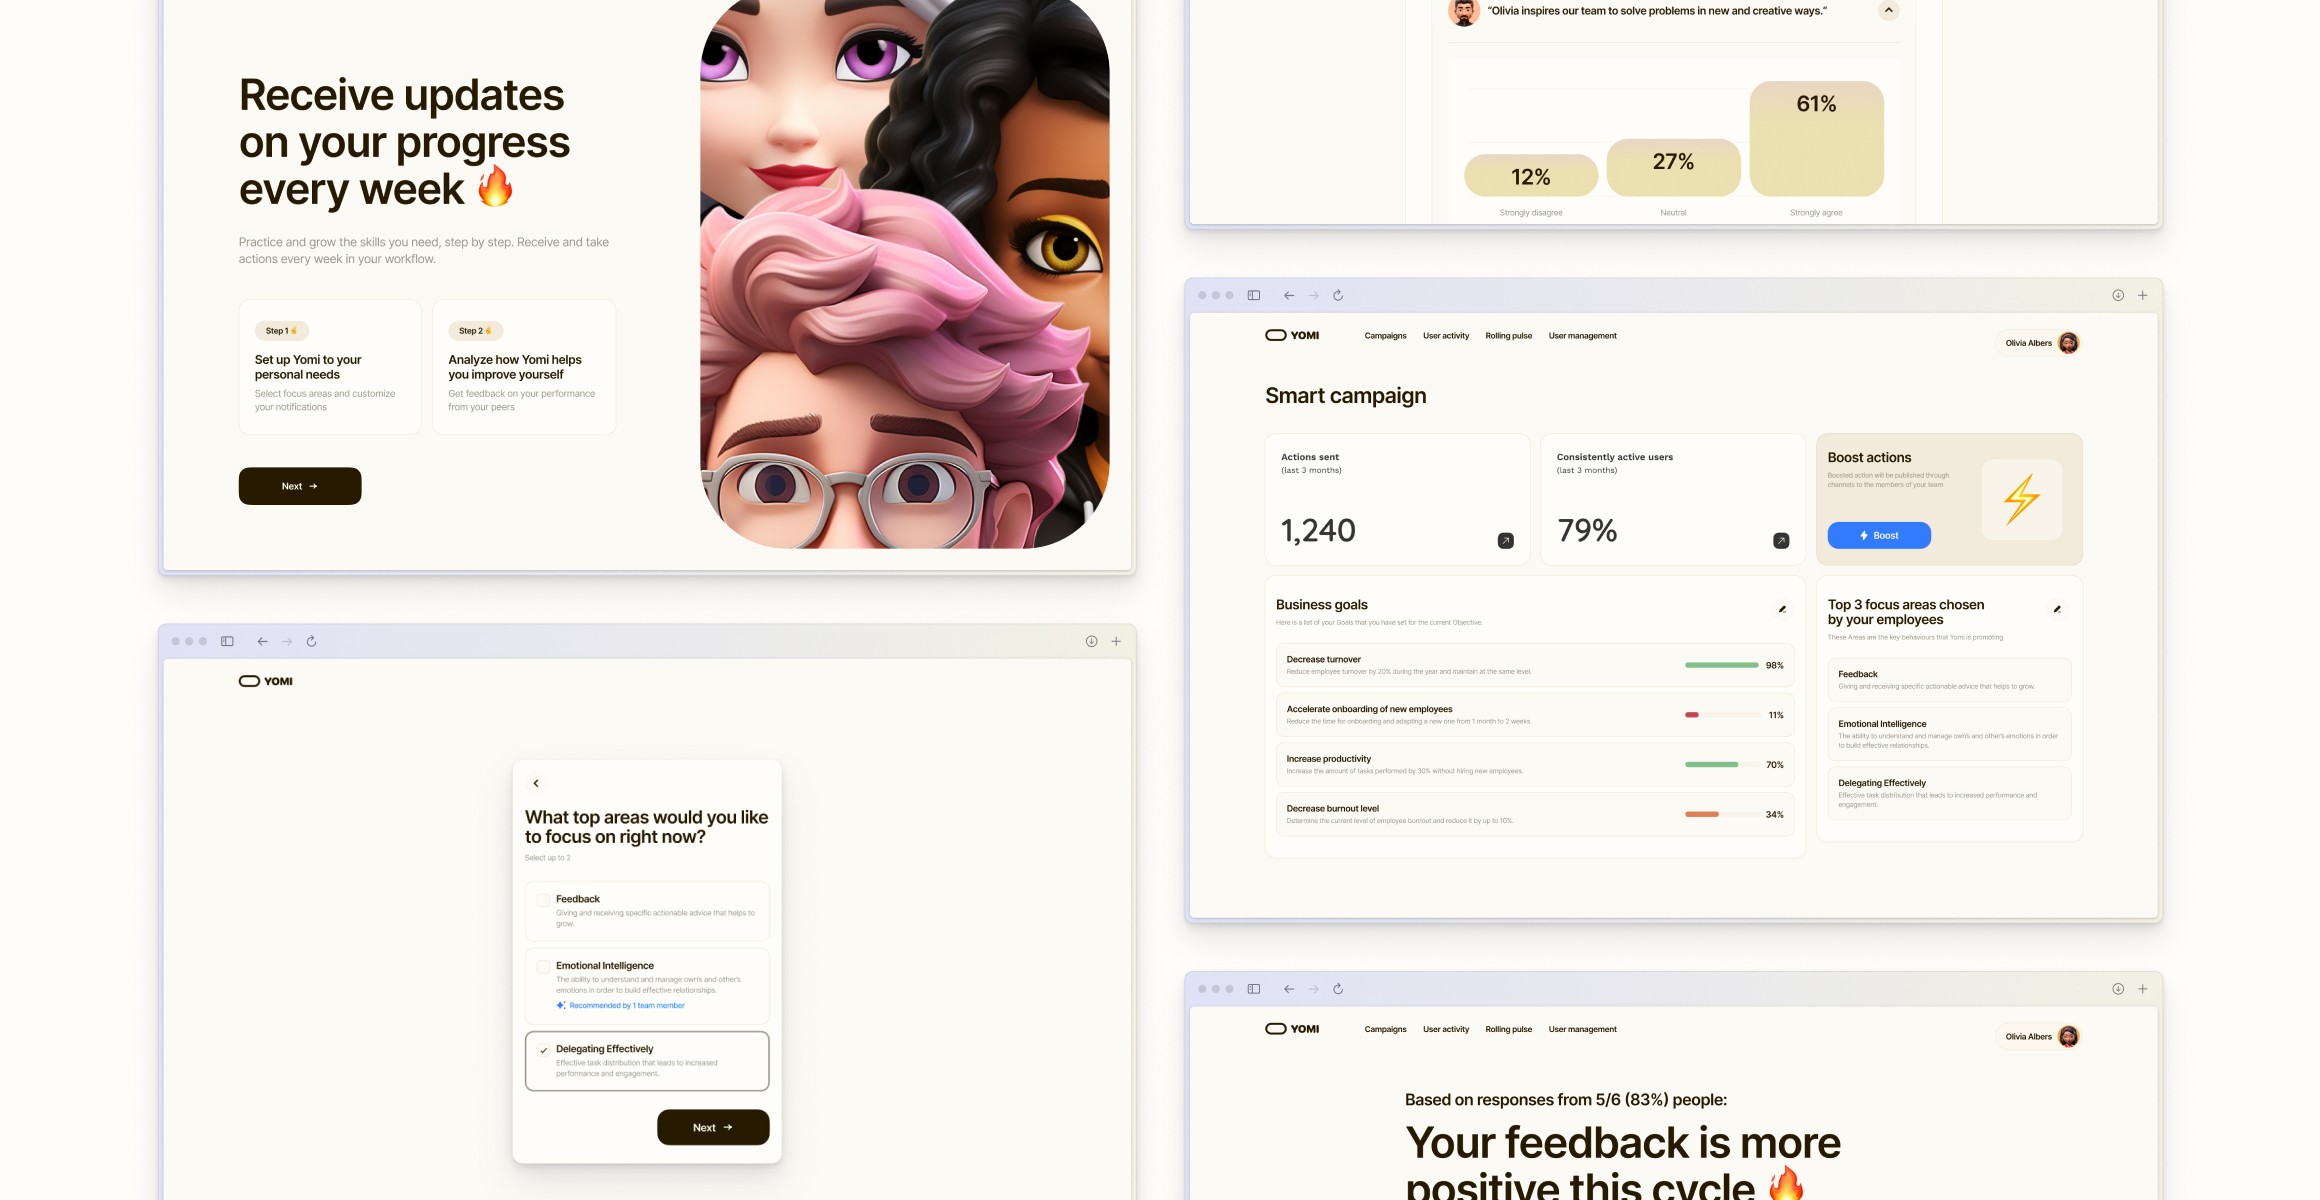
The original version of the product was like that. And we wanted to add more lightness and accessibility where possible. That's why we took the idea of contrasting business-like and something more frivolous as a basis for the visual language. This contrast helps to create accent huge headlines, calm background colors, 3D images and light tables. With this solution we added to the attractiveness of the product, which will improve the attraction of new customers in the future.
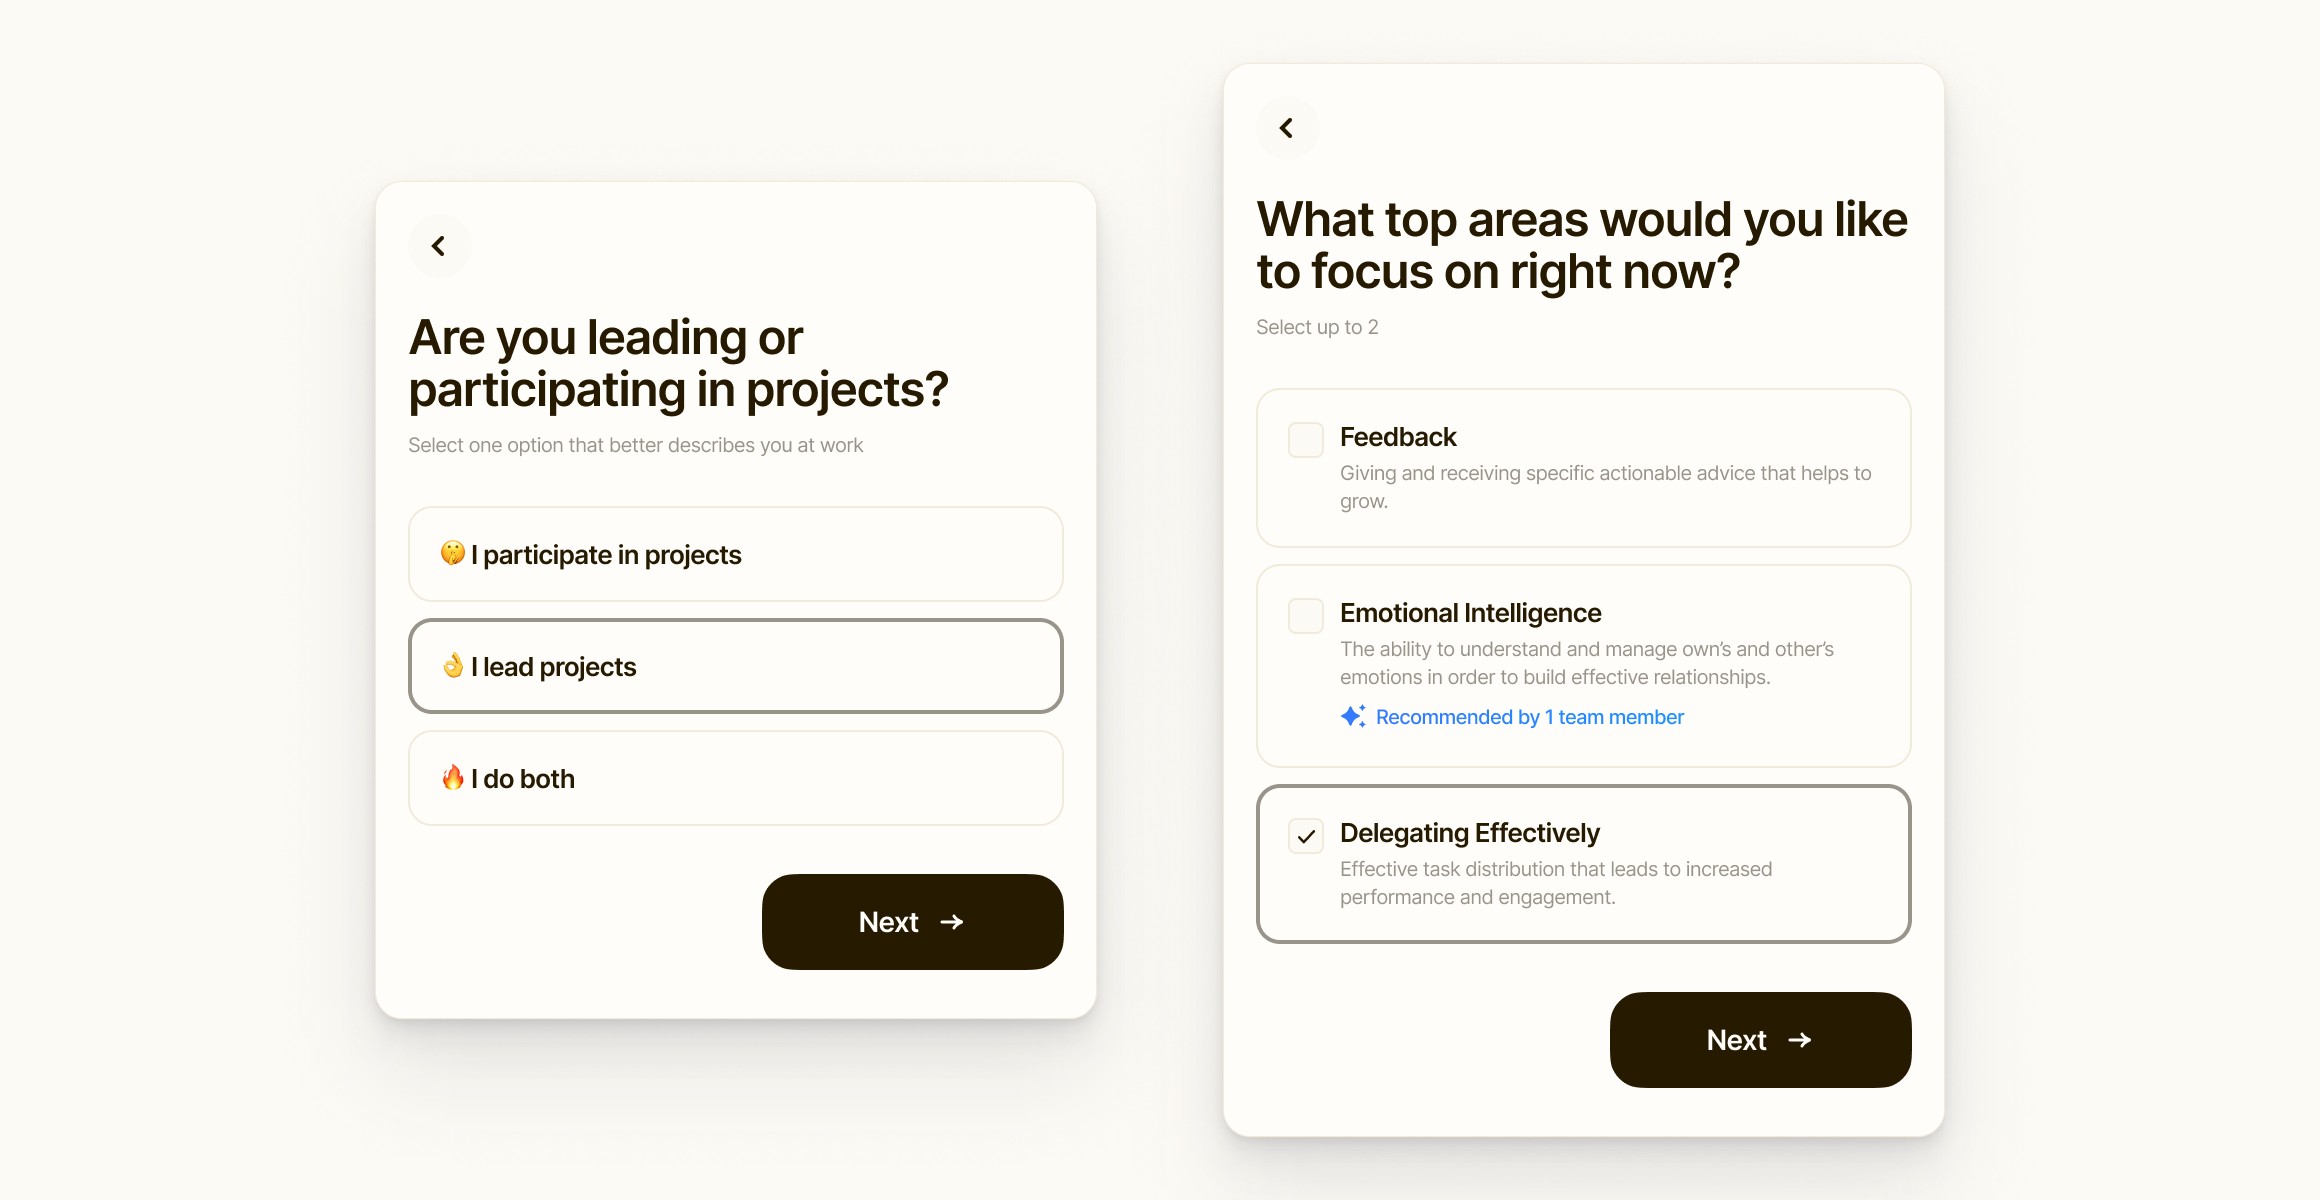
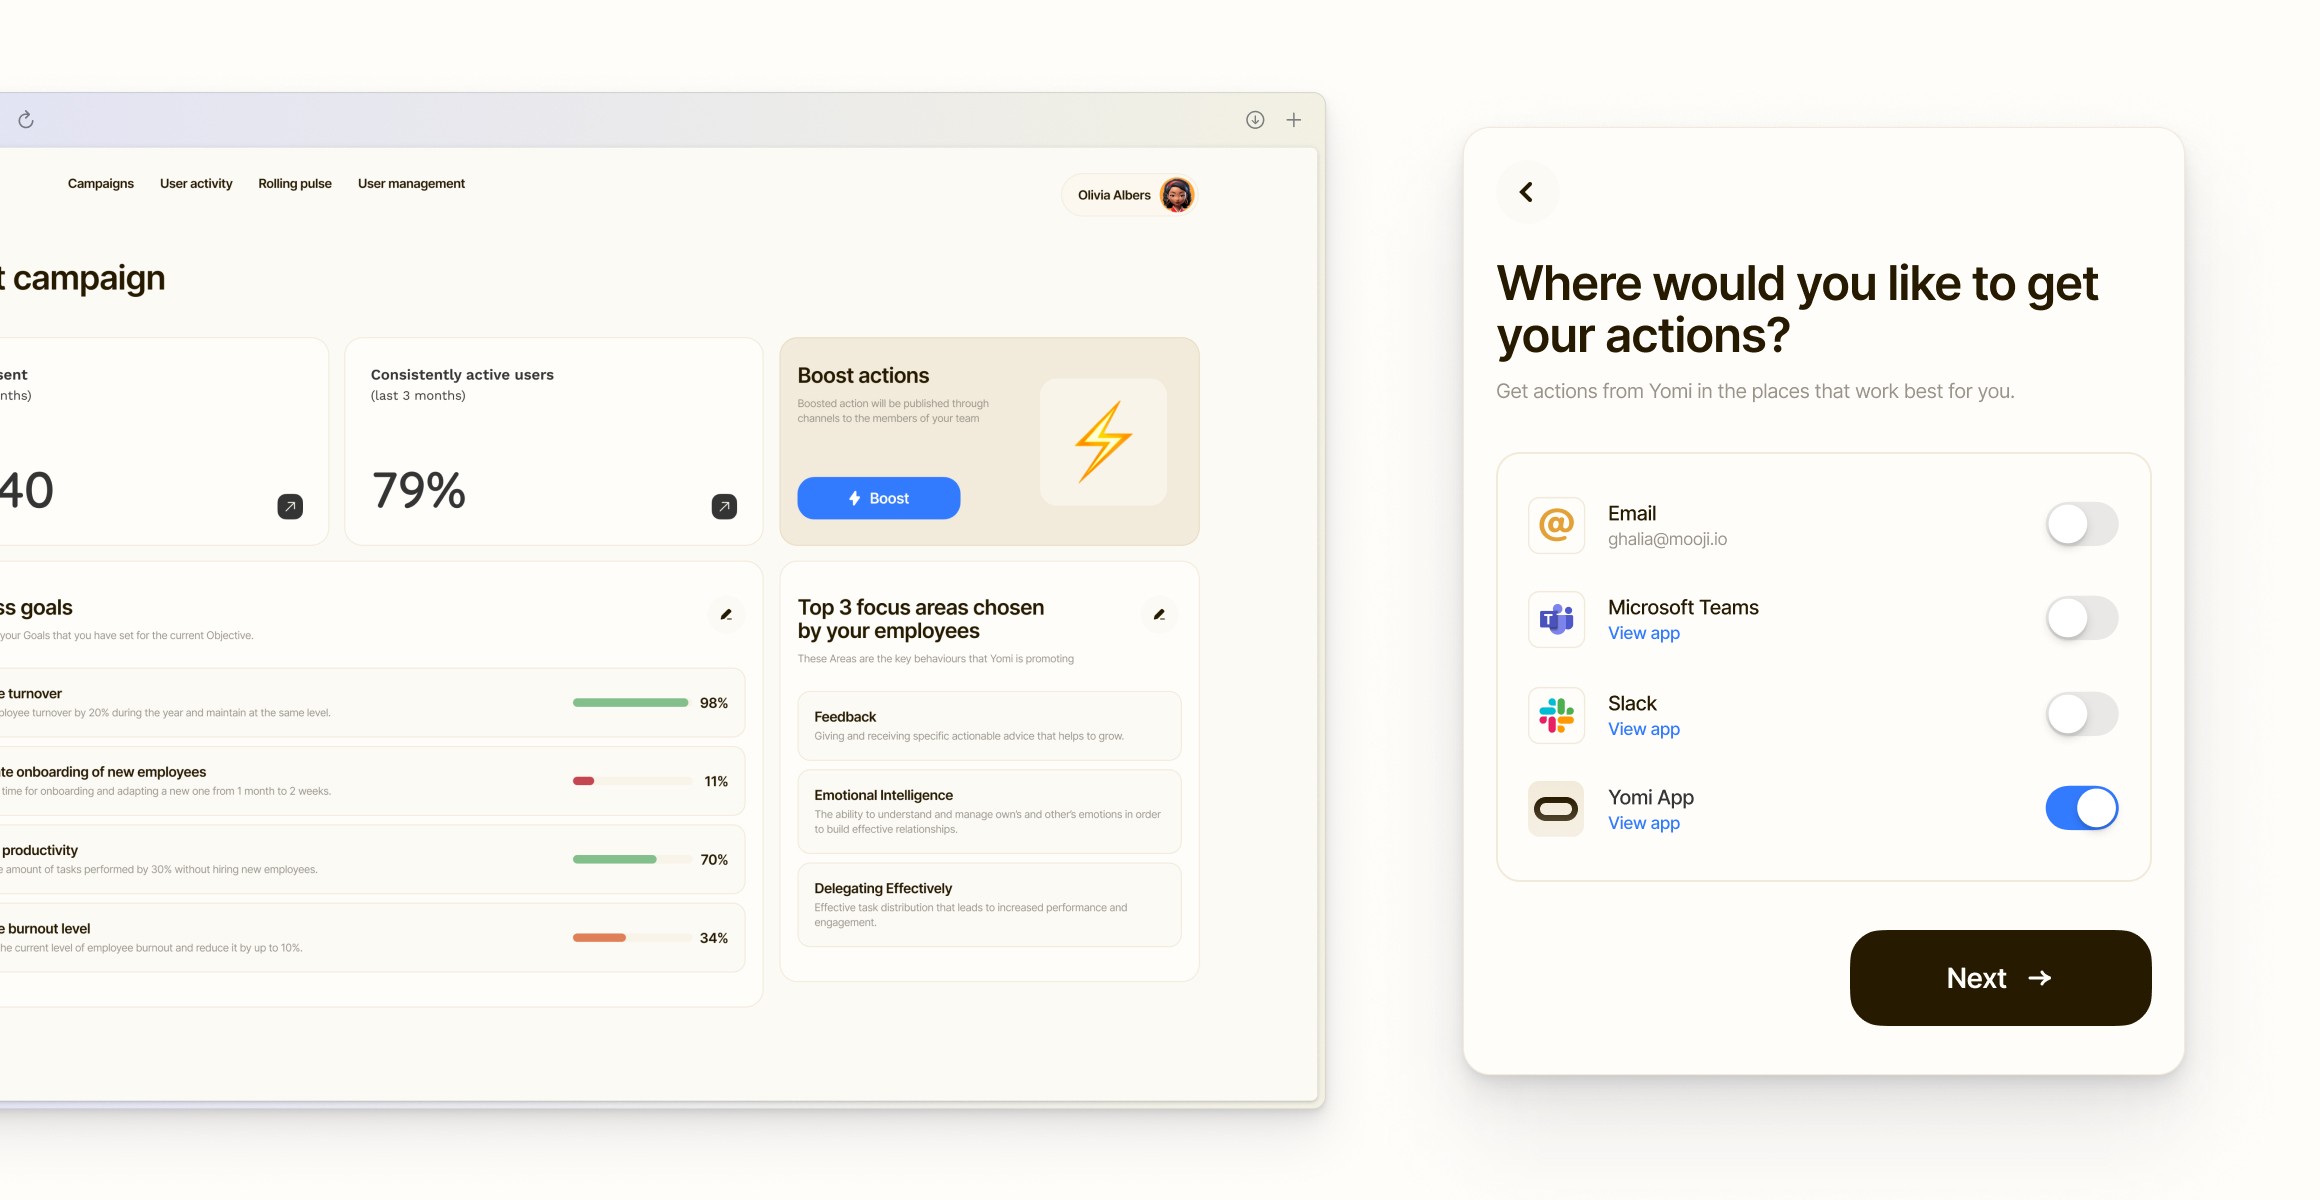
To improve onboarding of new users, I analyzed the entire flow-from first contact with the product to taking action. There were several steps that severely degraded the conversion rate. I restructured the flow, added new functionality based on user surveys, removed unnecessary things (such as mandatory filling of all fields, filling of description, etc.), added more flexibility. And wrapped everything in a new visual language. As a result, the conversion rate improved significantly.
There were also some problems related to the dashboard. After interviews with users it was found out that some of the functionality, which is typical for products with charts and tables, was not interesting for our users. Based on the insights from the interviews, I prepared a new dashboard, which we implemented in several iterations. Here we also conducted tests that helped us to make sure which solution was the right one.
Personal findings
This project is under NDA, so I can't share many business indicators.
User engagement increased by 32% thanks to the new dashboarding system.
The new onboarding flow raised the conversion rate from 54% to 89%.
After working with the visual part of the product and the new functionality, the company managed to get 4 new clients, as well as find new investors.
All current clients, who had expired contracts, decided to prolong cooperation due to the improvement of performance and closing the needs of users.
